UK dropped kerb statistics
Last reviewed: Page updated: Edited by our editor
How often councils refuse dropped kerbs, what they charge and how long they take, from our Freedom of Information requests to UK councils and the fees on 202 council websites. Every figure below updates when new council replies or fee checks are added, has its own link, and comes with a citation.
FOI data updated 20 November 2026 (latest council reply included) · Fees checked 3 to 12 October 2026
Download these statistics (CSV) Charts Methodology
Refusals and applications (FOI data)
Councils asked and replied
139 of 201
We sent the same Freedom of Information request to 201 UK highway authorities. 139 have replied so far, and 101 sent figures complete enough to compare (approvals and refusals, at least 20 decisions).
FOI data updated 20 November 2026 (latest council reply included). More: FOI data and every council reply
Cite this: Dropped Kerb Guide (2026), UK dropped kerb statistics: Councils asked and replied. https://www.droppedkerbguide.co.uk/dropped-kerb-statistics#councils-asked (FOI data updated 20 November 2026)
Overall refusal rate
11.0%
Across the 101 councils compared, 6,844 of 61,962 decided dropped kerb applications were refused (11.0%).
FOI data updated 20 November 2026 (latest council reply included). More: Refusal rates by council
Cite this: Dropped Kerb Guide (2026), UK dropped kerb statistics: Overall refusal rate. https://www.droppedkerbguide.co.uk/dropped-kerb-statistics#overall-refusal-rate (FOI data updated 20 November 2026)
Median council refusal rate
9.7%
The median council refused 9.7% of the dropped kerb applications it decided (101 councils, data years vary, mostly 2023 to 2025).
FOI data updated 20 November 2026 (latest council reply included). More: Refusal rates by council
Cite this: Dropped Kerb Guide (2026), UK dropped kerb statistics: Median council refusal rate. https://www.droppedkerbguide.co.uk/dropped-kerb-statistics#median-refusal-rate (FOI data updated 20 November 2026)
Range of refusal rates
0% to 84.8%
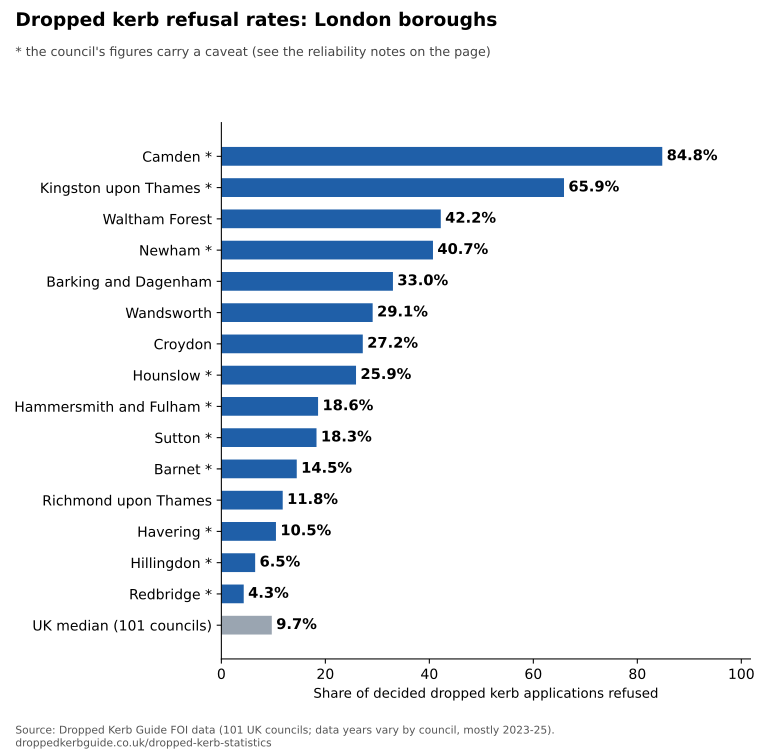
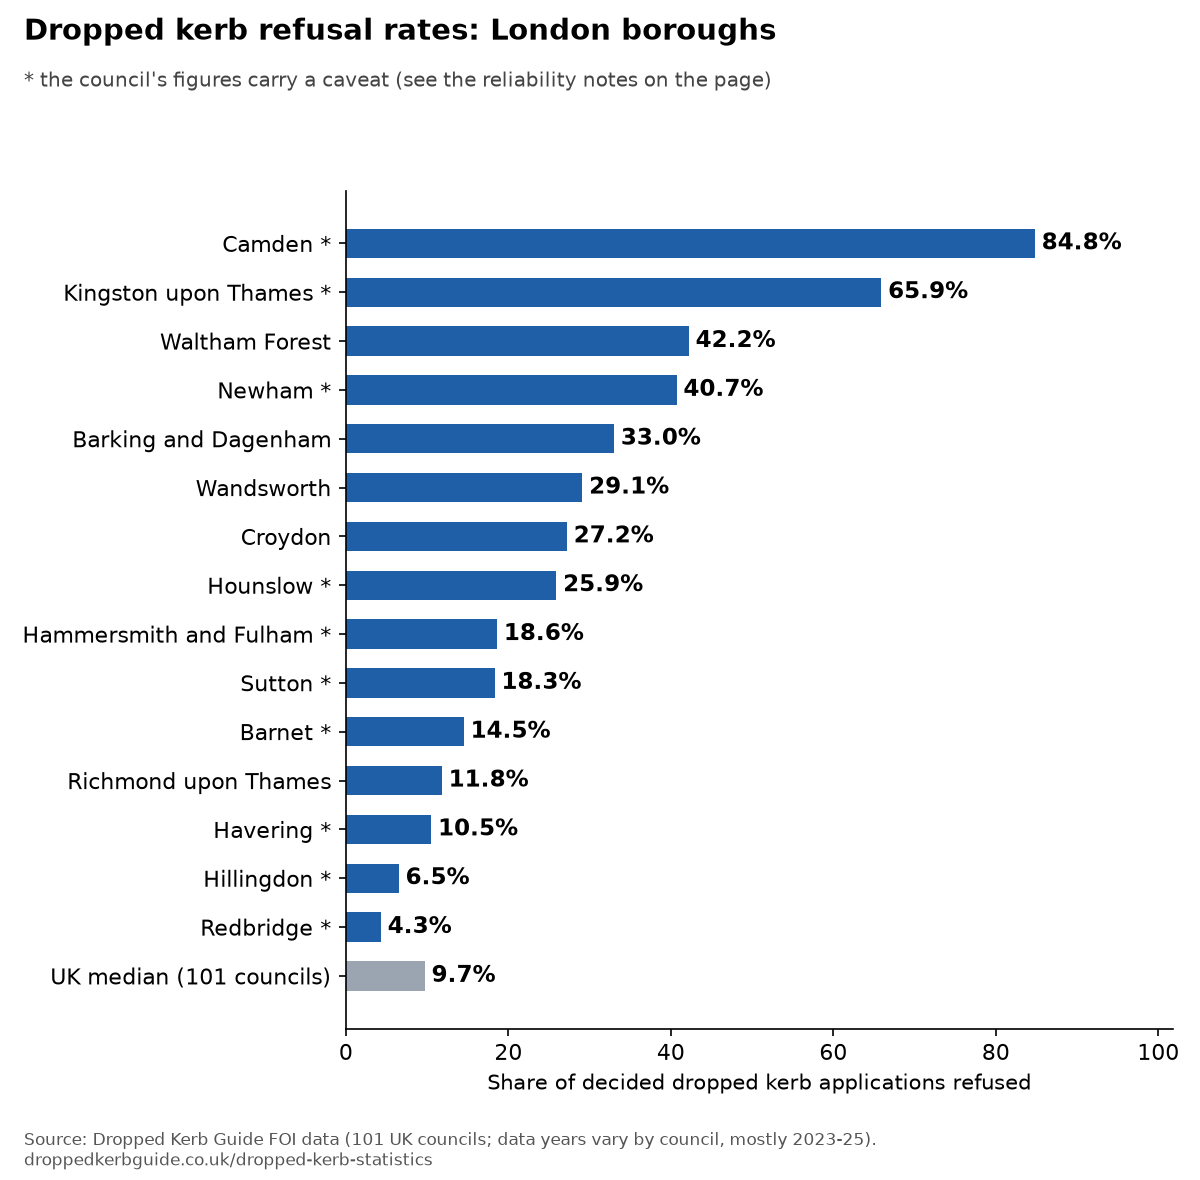
Council refusal rates range from 0% (Angus, County Durham, Dudley and Scottish Borders) to 84.8% in Camden, a small sample: 28 of 33 decided applications.
FOI data updated 20 November 2026 (latest council reply included). More: Refusal rates by council
Cite this: Dropped Kerb Guide (2026), UK dropped kerb statistics: Range of refusal rates. https://www.droppedkerbguide.co.uk/dropped-kerb-statistics#refusal-range (FOI data updated 20 November 2026)
London vs the rest of the UK
25.9% vs 9.0%
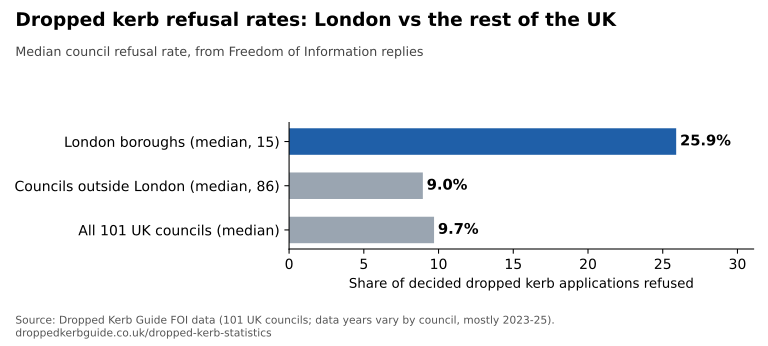
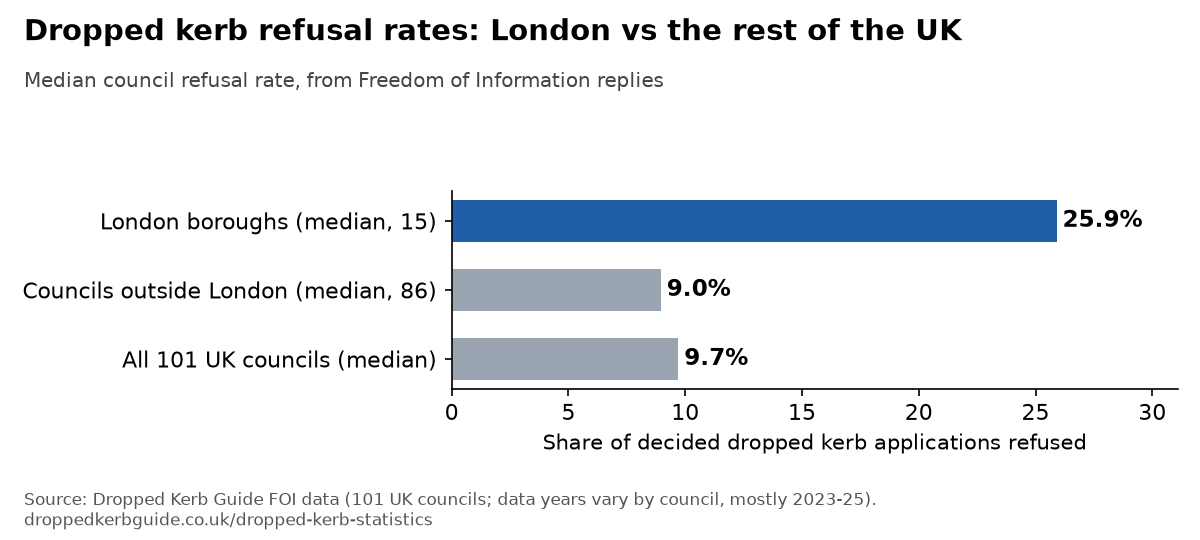
The median London borough refused 25.9% of decided applications, against 9.0% for the median council outside London (15 London boroughs and 86 other councils compared).
FOI data updated 20 November 2026 (latest council reply included). More: Refusal rates by council
Cite this: Dropped Kerb Guide (2026), UK dropped kerb statistics: London vs the rest of the UK. https://www.droppedkerbguide.co.uk/dropped-kerb-statistics#london-vs-rest (FOI data updated 20 November 2026)
London in the top ten
5 of 10
5 of the 10 highest council refusal rates in our data are London boroughs.
FOI data updated 20 November 2026 (latest council reply included). More: Refusal rates by council
Cite this: Dropped Kerb Guide (2026), UK dropped kerb statistics: London in the top ten. https://www.droppedkerbguide.co.uk/dropped-kerb-statistics#london-top-ten (FOI data updated 20 November 2026)
By nation
England 10.3% · Scotland 9.8% · Wales 7.2%
Median council refusal rate by nation: England 10.3% (78 councils); Scotland 9.8% (14 councils); Wales 7.2% (9 councils). We don't have Northern Ireland figures yet.
FOI data updated 20 November 2026 (latest council reply included). More: Refusal rates by council
Cite this: Dropped Kerb Guide (2026), UK dropped kerb statistics: By nation. https://www.droppedkerbguide.co.uk/dropped-kerb-statistics#by-nation (FOI data updated 20 November 2026)
By English region
5.0% to 25.9%
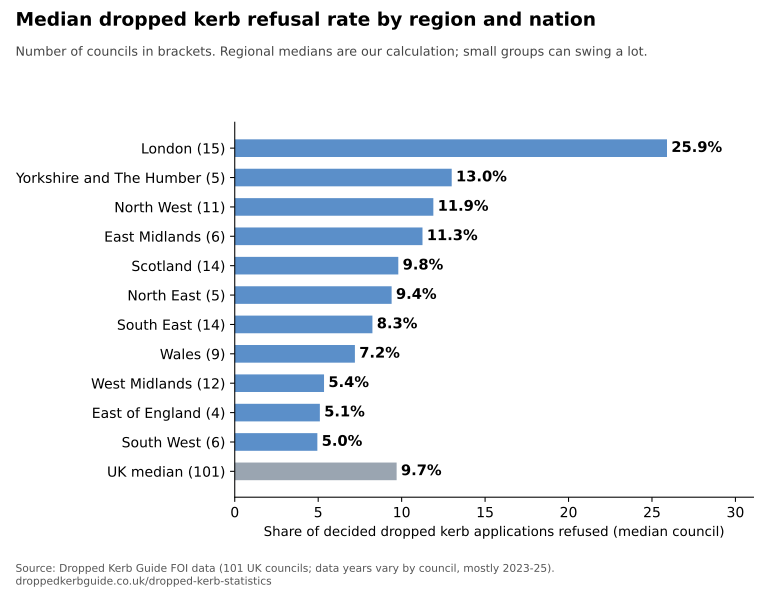
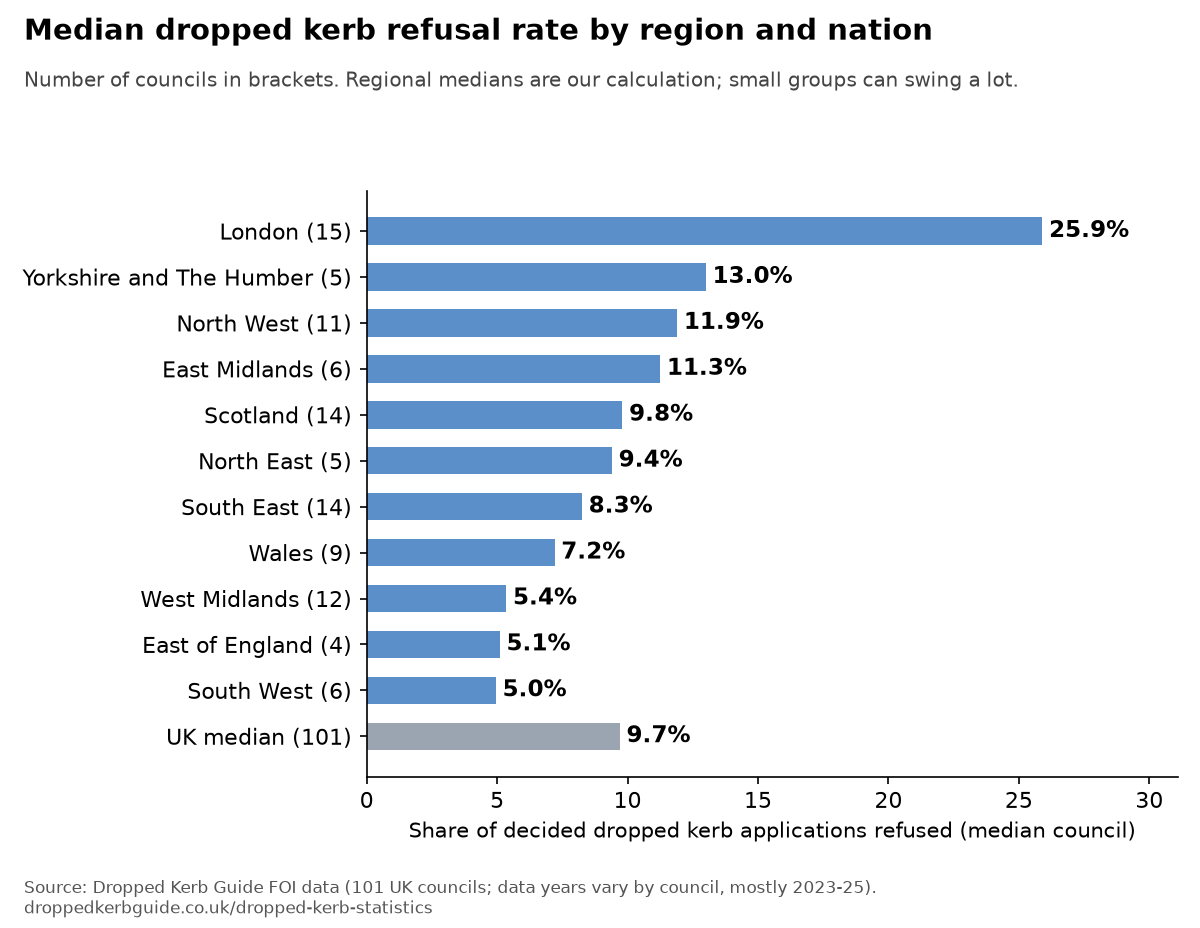
Among English regions, London has the highest median refusal rate (25.9%, 15 councils) and the South West the lowest (5.0%, 6 councils).
FOI data updated 20 November 2026 (latest council reply included). More: Refusal rates by council
Cite this: Dropped Kerb Guide (2026), UK dropped kerb statistics: By English region. https://www.droppedkerbguide.co.uk/dropped-kerb-statistics#by-region (FOI data updated 20 November 2026)
Top refusal reason
68 of 87
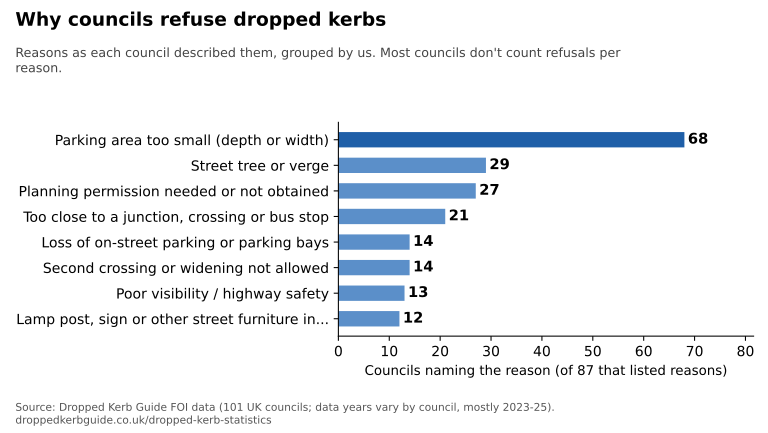
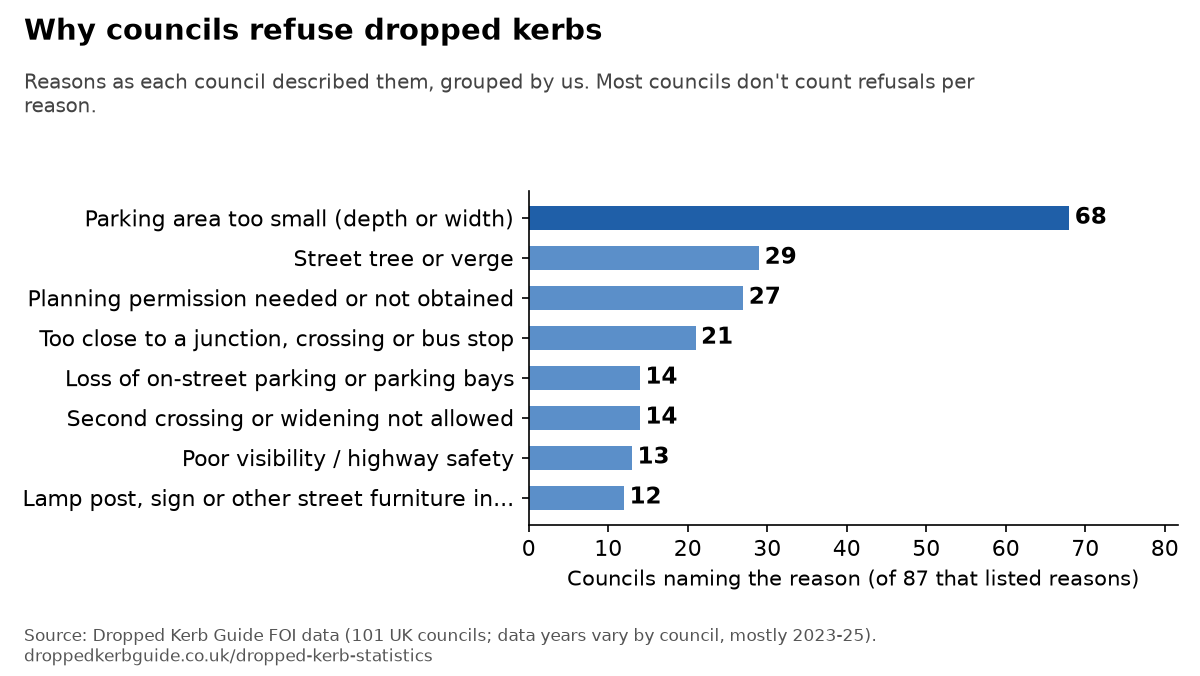
The most common reason councils gave for refusing a dropped kerb is “parking area too small (depth or width)”, named by 68 of the 87 compared councils that listed reasons. Next: street tree or verge (29), planning permission needed or not obtained (27) and too close to a junction, crossing or bus stop (21).
FOI data updated 20 November 2026 (latest council reply included). More: Why dropped kerbs get refused
Cite this: Dropped Kerb Guide (2026), UK dropped kerb statistics: Top refusal reason. https://www.droppedkerbguide.co.uk/dropped-kerb-statistics#top-refusal-reasons (FOI data updated 20 November 2026)
Applications received
85,771
The 126 councils that told us how many dropped kerb applications they received logged 85,771 between them over the years each supplied (mostly 2023 to 2025); the 101 councils compared decided 61,962.
FOI data updated 20 November 2026 (latest council reply included). More: FOI data and every council reply
Cite this: Dropped Kerb Guide (2026), UK dropped kerb statistics: Applications received. https://www.droppedkerbguide.co.uk/dropped-kerb-statistics#application-volumes (FOI data updated 20 November 2026)
Average decision time (FOI)
12 days
23 of the compared councils gave an average time to decide an application: the median is 12 days, from 5 (Hammersmith and Fulham) to 120 days (Gloucestershire). Councils count working or calendar days in different ways.
FOI data updated 20 November 2026 (latest council reply included). More: FOI data and every council reply
Cite this: Dropped Kerb Guide (2026), UK dropped kerb statistics: Average decision time (FOI). https://www.droppedkerbguide.co.uk/dropped-kerb-statistics#decision-times (FOI data updated 20 November 2026)
Refusal rates by region and nation
| Region or nation | Councils | Median refusal rate | Refused of decided |
|---|---|---|---|
| London | 15 | 25.9% | 1,246 of 7,476 |
| Yorkshire and The Humber | 5 | 13.0% | 429 of 2,776 |
| North West | 11 | 11.9% | 698 of 5,086 |
| East Midlands | 6 | 11.3% | 1,022 of 6,402 |
| Scotland | 14 | 9.8% | 323 of 2,664 |
| North East | 5 | 9.4% | 197 of 3,395 |
| South East | 14 | 8.3% | 1,469 of 12,824 |
| Wales | 9 | 7.2% | 197 of 2,324 |
| West Midlands | 12 | 5.4% | 758 of 9,646 |
| East of England | 4 | 5.1% | 239 of 4,597 |
| South West | 6 | 5.0% | 266 of 4,772 |
Fees and decision times
Councils publishing a target time
50 of 202
50 of the 202 UK highway authorities we cover publish a target or typical decision time on their website. The most common wordings are “up to 28 days”, “up to 10 weeks”, “up to 8 weeks” and “20 working days” (3 councils each).
Fees checked on council websites 3 to 12 October 2026. More: Dropped kerb timeline
Cite this: Dropped Kerb Guide (2026), UK dropped kerb statistics: Councils publishing a target time. https://www.droppedkerbguide.co.uk/dropped-kerb-statistics#published-targets (fees checked 3 to 12 October 2026)
Council fee range
£47 to £875
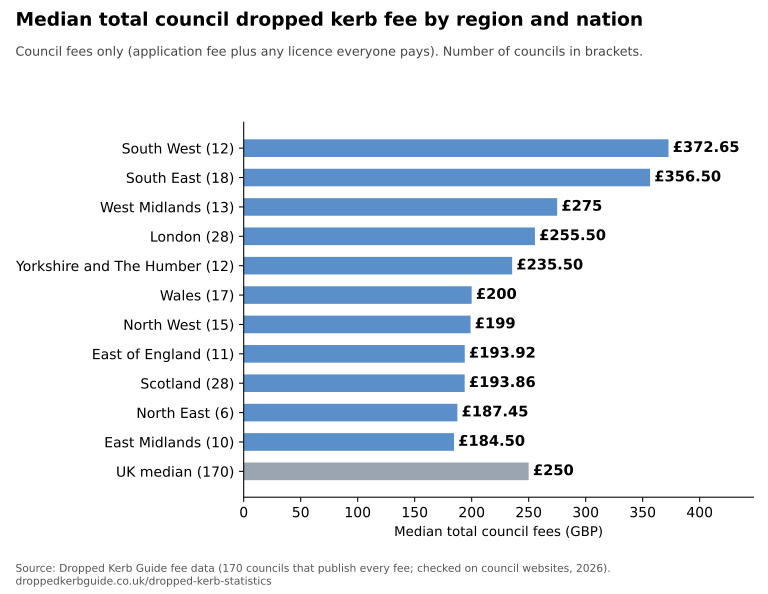
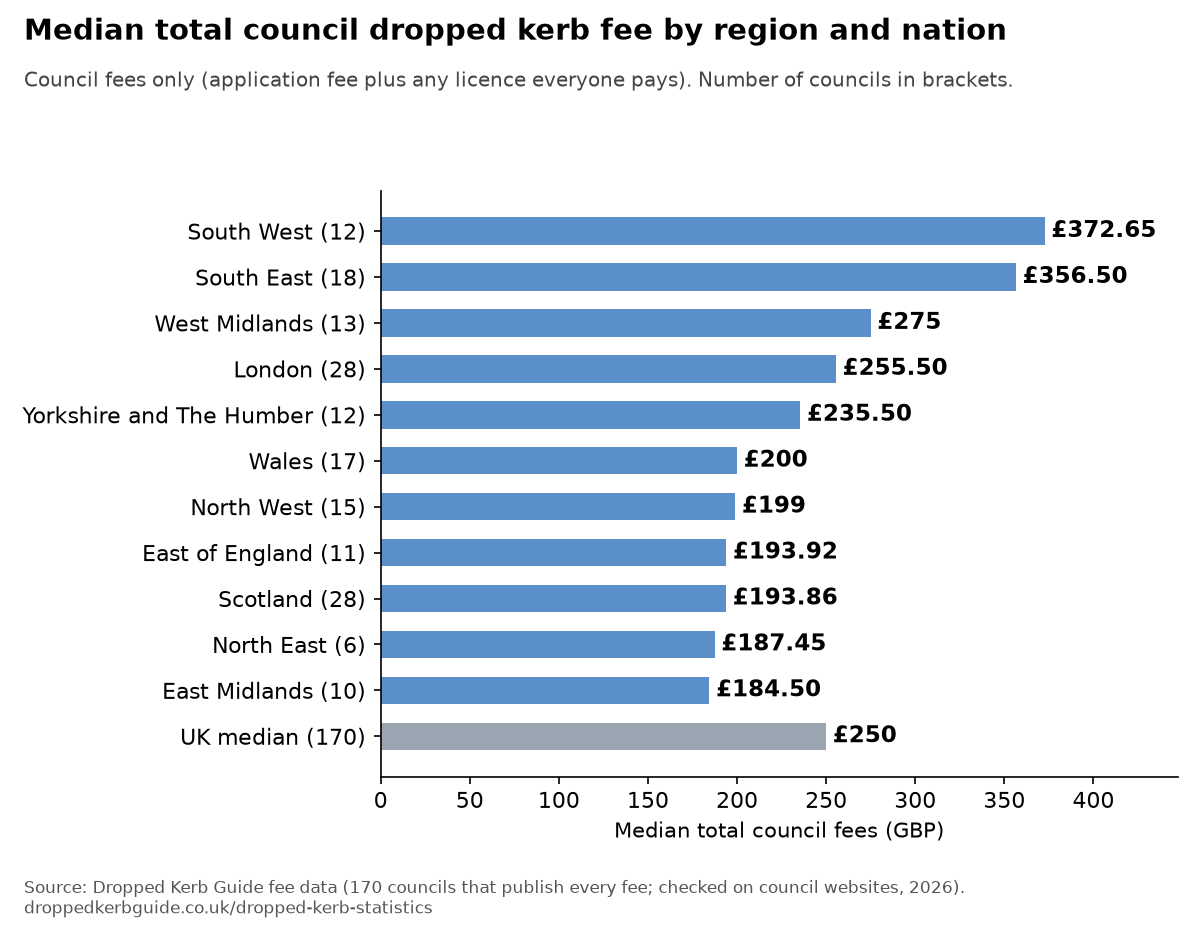
Total council dropped kerb fees range from £47 to £875 across the 170 UK councils that publish every fee: the dearest charges 18.6 times the cheapest.
Fees checked on council websites 3 to 12 October 2026. More: UK Dropped Kerb Fee Index 2026
Cite this: Dropped Kerb Guide (2026), UK dropped kerb statistics: Council fee range. https://www.droppedkerbguide.co.uk/dropped-kerb-statistics#fee-range (fees checked 3 to 12 October 2026)
Median council fee
£250
The median total council dropped kerb fee is £250 (average £281.10); 69 councils charge under £200 in total and 34 charge over £400.
Fees checked on council websites 3 to 12 October 2026. More: UK Dropped Kerb Fee Index 2026
Cite this: Dropped Kerb Guide (2026), UK dropped kerb statistics: Median council fee. https://www.droppedkerbguide.co.uk/dropped-kerb-statistics#fee-median (fees checked 3 to 12 October 2026)
Cheapest and dearest
£47 / £875
The cheapest council in total fees is Bolton (£47) and the dearest is Waltham Forest (£875).
Fees checked on council websites 3 to 12 October 2026. More: Council fees league table
Cite this: Dropped Kerb Guide (2026), UK dropped kerb statistics: Cheapest and dearest. https://www.droppedkerbguide.co.uk/dropped-kerb-statistics#fee-cheapest-dearest (fees checked 3 to 12 October 2026)
Fees by nation
England £261 · Scotland £193.86 · Wales £200
Median total council fee by nation: England £261 (125 councils); Scotland £193.86 (28 councils); Wales £200 (17 councils). Northern Ireland has one roads authority (DfI Roads).
Fees checked on council websites 3 to 12 October 2026. More: UK Dropped Kerb Fee Index 2026
Cite this: Dropped Kerb Guide (2026), UK dropped kerb statistics: Fees by nation. https://www.droppedkerbguide.co.uk/dropped-kerb-statistics#fee-by-nation (fees checked 3 to 12 October 2026)
Charts
Each chart is regenerated from the data whenever it changes. You’re welcome to use them with the credit “Source: Dropped Kerb Guide” and a link to this page.
Look up your own council
- Find your council: fees, rules and who builds the crossing, by postcode.
- Refusal rates by council: the full ranking of the 101 councils, with years, totals and references.
- UK Dropped Kerb Fee Index 2026 and the council fees league table.
- FOI data: every council reply, what each could tell us and the full download.
- Why dropped kerbs get refused and how to avoid the common reasons.
Applying yourself? The free approval chances check and fee comparison use the same data. If you’d rather not draw the plan yourself, our £129 application service prepares the drawing and form answers.
Methodology
- FOI data. Between 13 October 2026 and 26 October 2026 we sent the same request (FOIA, the Environmental Information Regulations or, in Scotland, FOISA) to 201 UK highway authorities, asking how many dropped kerb (vehicle crossing) applications they received, approved and refused in 2023, 2024 and 2025, the most common refusal reasons, average decision times and current fees. 139 have replied; 61 are still due (the last by 10 December 2026).
- Refusal rate = refused ÷ (approved + refused) over the years each council supplied, so withdrawn and undecided applications are left out. A council is compared only if it gave approvals and refusals with at least 20 decisions; partial replies and replies awaiting re-use permission are left out.
- Medians are the middle council’s rate (each council counts once, whatever its size). The overall rate pools every refusal and decision, so large councils weigh more. Regional and London medians are our calculation from the published table. Percentages are rounded half up to one decimal place (8.65% shows as 8.7%).
- Years differ. Some councils use calendar years and some financial years; a few gave only part of the period. See the Years column on the refusal-rates table.
- Reasons are our short summaries of what each council told us, grouped into categories. Most councils don’t count refusals per reason, so we count how many councils named each one.
- Fees were read from each council’s own website (3 to 12 October 2026). Total council fees are the application fee plus any other council fee everyone pays; build costs are not included. The fee statistics use the 170 councils that publish every fee and are taking applications.
- Published decision times are targets or typical times stated on council websites, not measured times.
Caveats and reliability notes
- Small samples. 11 compared councils decided fewer than 100 applications: Camden (33), Clackmannanshire (83), Conwy (66), East Lothian (87), Hammersmith and Fulham (43), Kingston upon Thames (41), Merthyr Tydfil (92), Newham (54), Scottish Borders (94), Wandsworth (79) and West Dunbartonshire (97). Their rates can move a lot with a few decisions.
- Partial data. 36 replies were partial and aren’t in the comparison; 61 councils haven’t replied yet. Small regional groups (for example a region with 3 councils) are not a reliable guide to the whole region.
- Councils’ own notes on their figures:
- Aberdeen: Years as given in the reply (calendar or financial not stated). Approved plus refused is below applications received each year (29 in total); those gaps are not treated as refused.
- Barnet: Financial years 2023-24 to 2025-26. Approved plus refused is below applications received each year (222 in total); those gaps are not treated as refused.
- Bath & North East Somerset: 30 applications were pending (waiting for payment or planning permission, described as Pass Back to Applicant). Those are not treated as refused.
- Birmingham: Approved plus refused is well below applications received; some applications were outstanding, withdrawn, cancelled, expired, or not clearly recorded as an approval or a refusal.
- Bracknell Forest: Approved plus refused is below applications received (58 in total); the council did not explain the gap, and those applications are not treated as refused.
- Camden: Small number of decided applications (33 in total across 2023–2025).
- Coventry: The council said the numbers may not fully align because of overlap and the timing of when the application was made; approved can exceed received. Those differences are not adjusted.
- Essex: Approved plus refused is below applications received (154 in total); those gaps are not treated as refused.
- Hammersmith and Fulham: 2025 was a small year (5 applications); the council named a pause on crossover applications as a refusal reason that year.
- Havering: Havering sent a casework log rather than annual totals. We counted one outcome per enquiry (the last recorded outcome, plus rows with no enquiry number) for calendar years 2023 to 2025. 131 enquiries were undecided or had a refusal reason but no yes/no; those are not treated as refused.
- Hillingdon: The reply labels the last refused figure as 2026; it is counted as 2025 because approved plus refused then equals applications received, as in every other year.
- Hounslow: Approved plus refused is well below applications received (321 in total); the council did not explain the gap, and those applications are not treated as refused.
- Kent: Approved plus refused is below applications received each year (424 applications in total were not counted as approved or refused). Those gaps are not treated as refused.
- Kingston upon Thames: Small number of applications a year (32, 18 and 6 received). Annual figures were summed from the council's monthly granted/refused figures; applications not stated as granted or refused are not counted as refused.
- Leicester: 162 applications were described as started but not continued through to construction, or rejected as out of time, and are not treated as refused.
- Merthyr Tydfil: Financial years 2024-25 and 2025-26 only (2023-24 not given). A part-year 2026-27 supplied by the council is not included.
- Newham: 2023 figures were not given, and a part-year 2026 supplied by the council is not included. Approved plus refused is slightly below received (4 in total); those gaps are not treated as refused.
- North East Lincolnshire: 41 applications in the received totals were duplicated, withdrawn or undetermined, and are not treated as refused.
- North Lanarkshire: The council's refused figures include applications where the fee wasn't paid, the customer cancelled, or the wrong application type was used, so the true refusal rate on merits is likely lower.
- Northumberland: Approved plus refused is below applications received in 2023-24 and 2025-26; in 2024-25 approved plus refused (253) is higher than received (238). Those differences are not adjusted. The council also gave a part-year 2026-27, which is not included.
- Nottingham: Approved plus refused is below applications received each year (25 applications in total were not counted as approved or refused). Those gaps are not treated as refused.
- Oldham: Approved plus refused is below applications received (34 in total); those gaps are not treated as refused.
- Perth and Kinross: The 35 refused include 16 where payment was not made and 7 where further information was not received.
- Redbridge: Approved plus refused is well below applications received each year (342 applications in total were not counted as approved or refused). Those gaps are not treated as refused.
- Rotherham: 2023 figures are not held. Approved plus refused is below applications received in 2024 and 2025; the council said the received total includes applications still awaiting a decision, and that some do not progress because of incomplete information. Those gaps are not treated as refused.
- Sefton: Domestic installations only. Approved plus refused is below applications received each year (71 applications in total were not counted as approved or refused). Those gaps are not treated as refused.
- Solihull: Approved plus refused is 2 below applications received in 2023-24; that gap is not treated as refused.
- South Ayrshire: In 2025, 15 applications were refused, one of which was later approved upon appeal, so approved plus refused that year is 1 above received. That difference is not adjusted.
- Southampton: Approved plus refused is below applications received (15 in total); those gaps are not treated as refused.
- St Helens: Figures cover only financial year 2025-26, after a change in asset management software. 164 applications were awaiting a site visit or approval and are not treated as refused.
- Surrey: The council said that because of a change in works systems in 2023 and process changes in March 2024 and January 2026 the data cannot be relied on 100%, but provides an overall number. 426 applications are recorded as Unknown (no clear approved or rejected record) and are not treated as refused.
- Sutton: The council said the totals include a small number of Section 278 highway works applications and refunded or withdrawn submissions, which are not separated in its historical logs.
- Trafford: Financial years 2023-24 to 2025-26. 21 applications were cancelled or have no recorded outcome; those are not treated as refused.
- Walsall: The council said the gap between applications received and those approved or refused is applicants who did not pay the fee.
- Warwickshire: The published rate covers 2023 to 29 September 2026, because approved and refused were only given as a combined total. Some applications never proceeded (no fee paid, or awaiting correspondence) and are not treated as refused.
- West Sussex: The council said a system change on 2 April 2024 means some figures may not be completely accurate, and refusal reasons for 2023 and early 2024 could not be retrieved.
- Wigan: Figures cover only November 2025 to 19 October 2026, after a system upgrade. 104 applications awaiting hardstanding or planning permission, and a further 15 in the remaining gap, are not treated as refused.
- Wiltshire: Approved plus refused is below applications received (116 in total); an application may be received in one year and decided in another, and a refused application can later be approved. Those gaps are not treated as refused.
- Wokingham: The refused totals include 41 applications recorded as no response from the resident. Approved plus refused is below applications received (53 in total); those gaps are not treated as refused.
- Wolverhampton: Approved plus refused is below applications received each year; those gaps are not treated as refused.
Download and reuse
Download these statistics (CSV) One row per statistic, with its value, base and the date the data was updated. The council-level data is in the FOI data CSV and the fees CSV.
You can quote these figures and use the charts for free, including in articles, with a credit to Dropped Kerb Guide and a link to this page. FOI figures are as supplied by each council and credited with its reference on the refusal-rates page. Fee data contains public sector information licensed under the Open Government Licence v3.0.